The San Marco Market Update

Heather Buckman
Heather’s background in technology, marketing, and social work made real estate the perfect career! When people are buying or selling a house, they ...
Heather’s background in technology, marketing, and social work made real estate the perfect career! When people are buying or selling a house, they ...
The San Marco Market Update
A month by month look at the housing trends in San Marco.
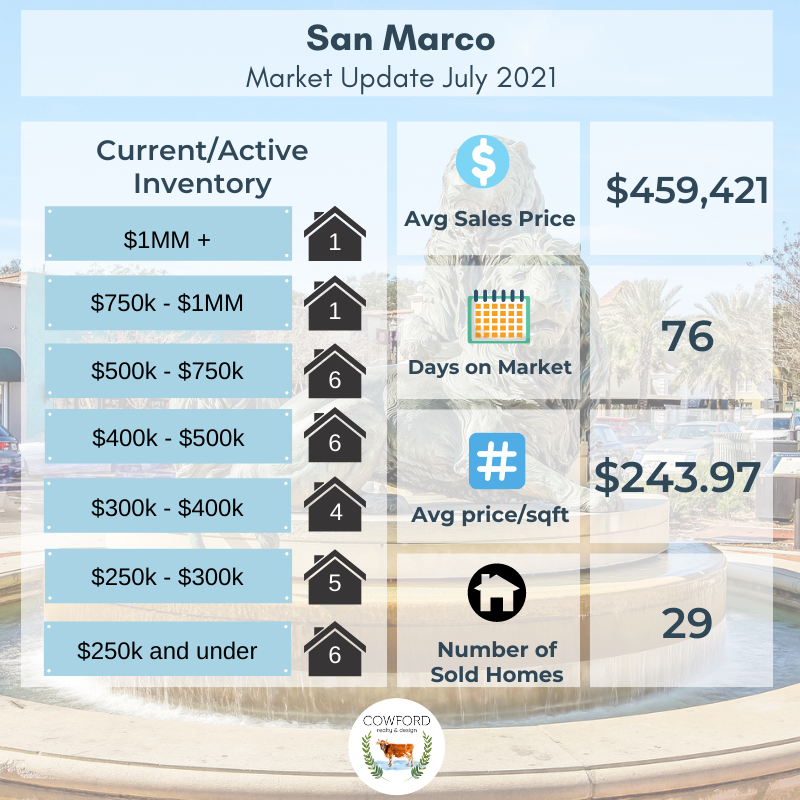
July 2021
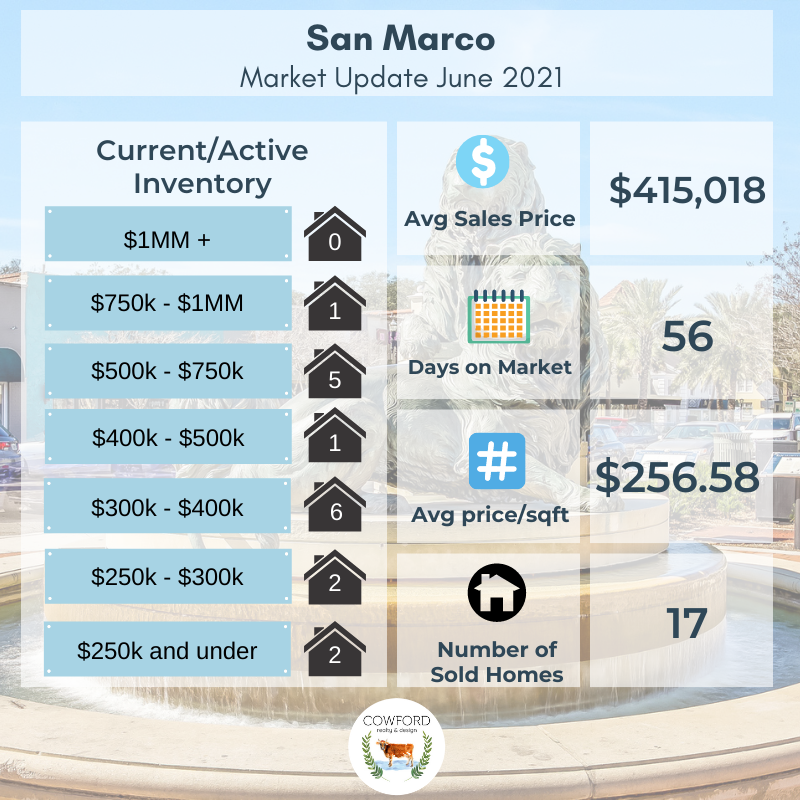
June 2021
May 2021

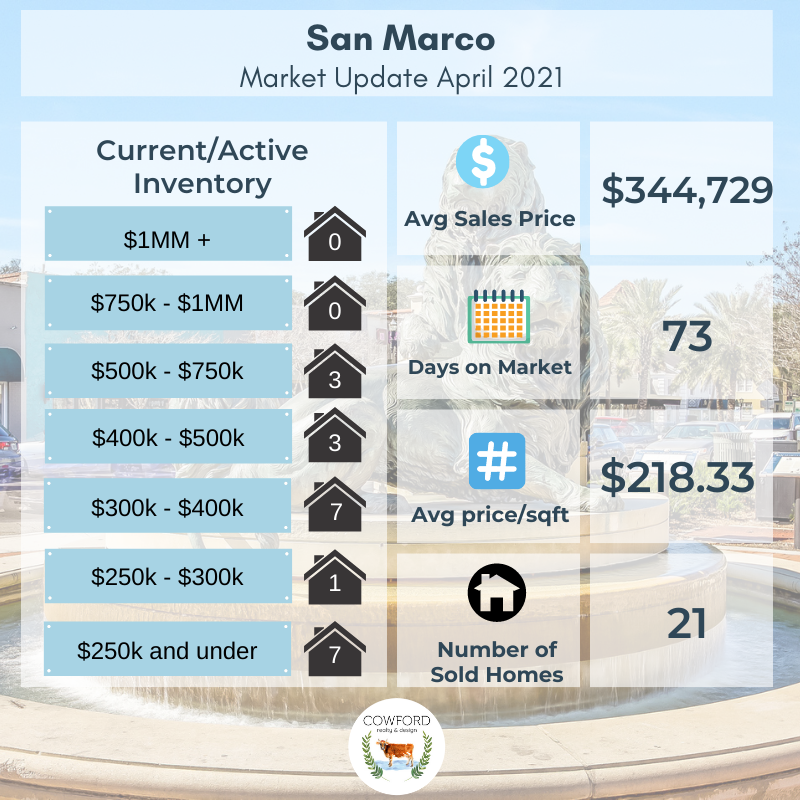
April 2021
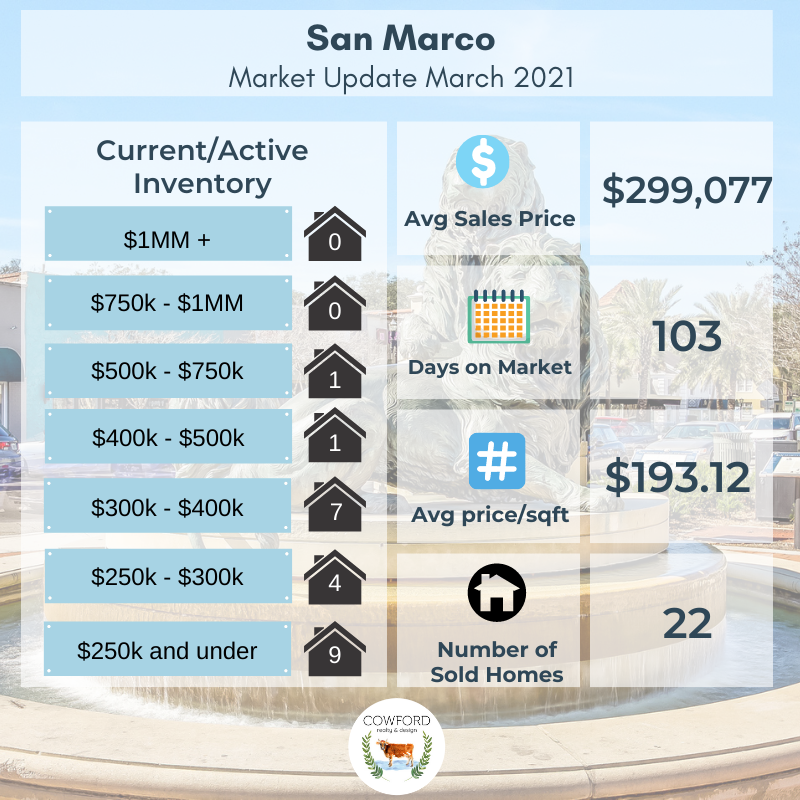
March 2021
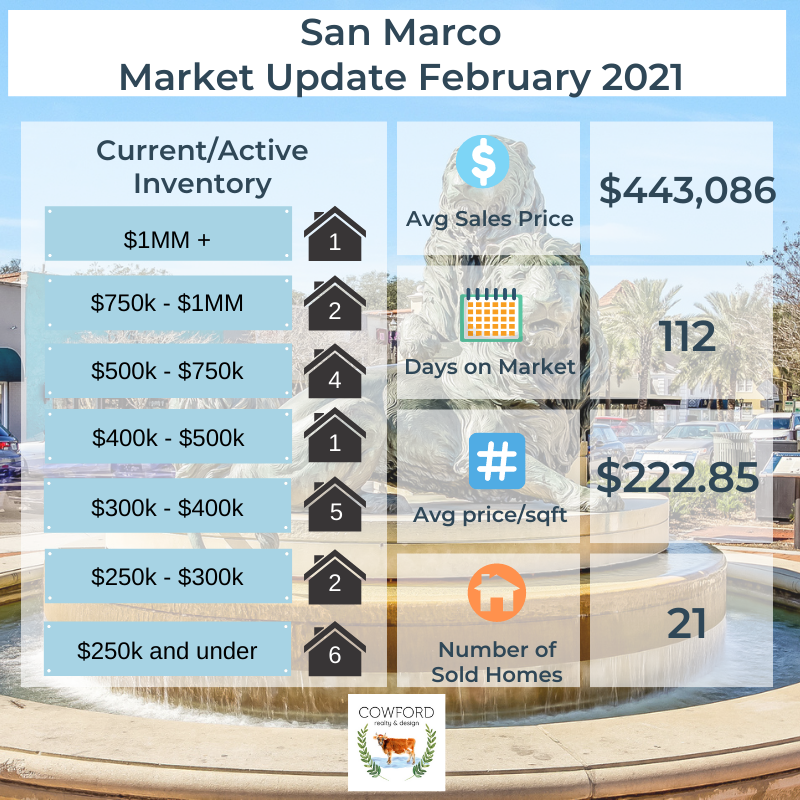
February 2021
January 2021

December 2020

November 2020

October 2020

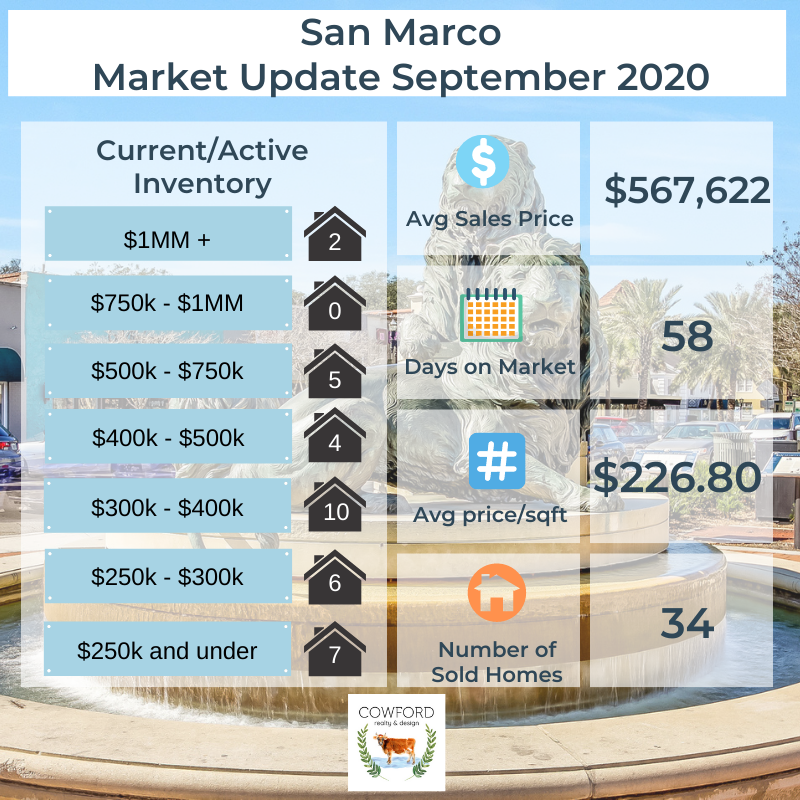
September 2020
August 2020

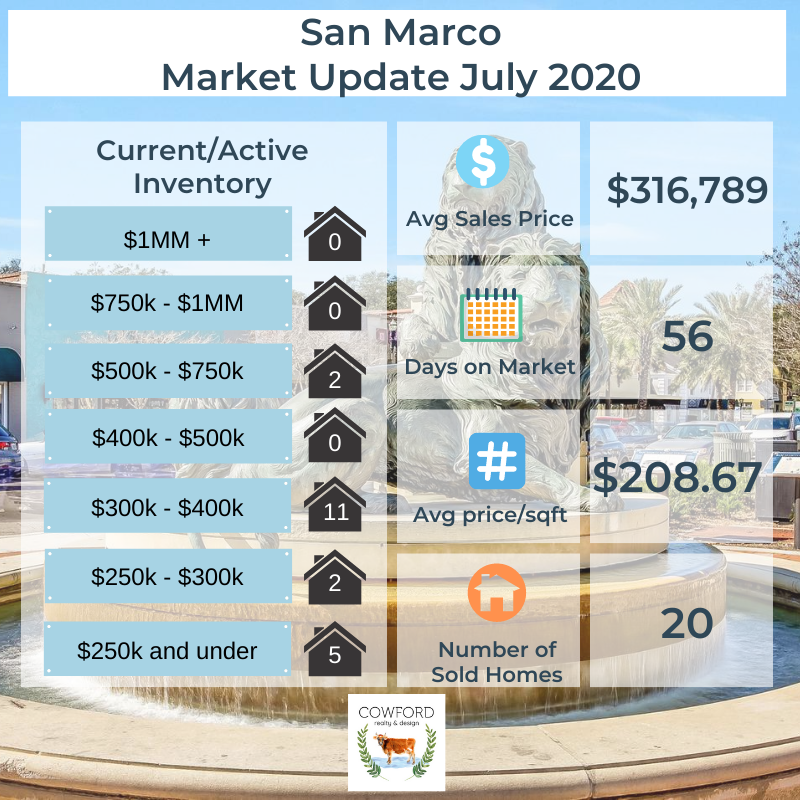
July 2020
June 2020

May 2020

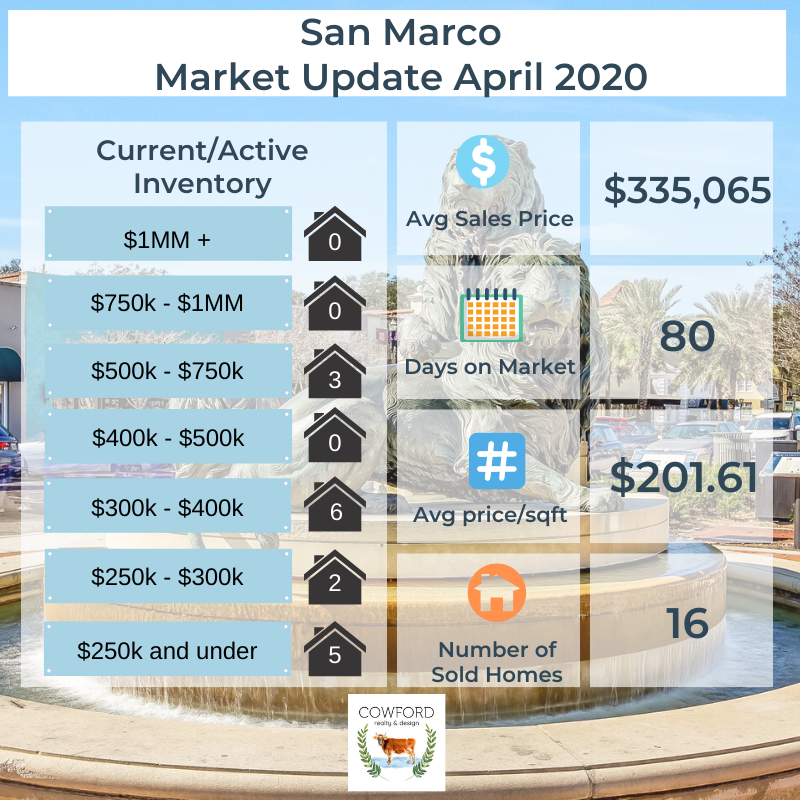
April 2020
March 2020

February 2020

January 2020

December 2019

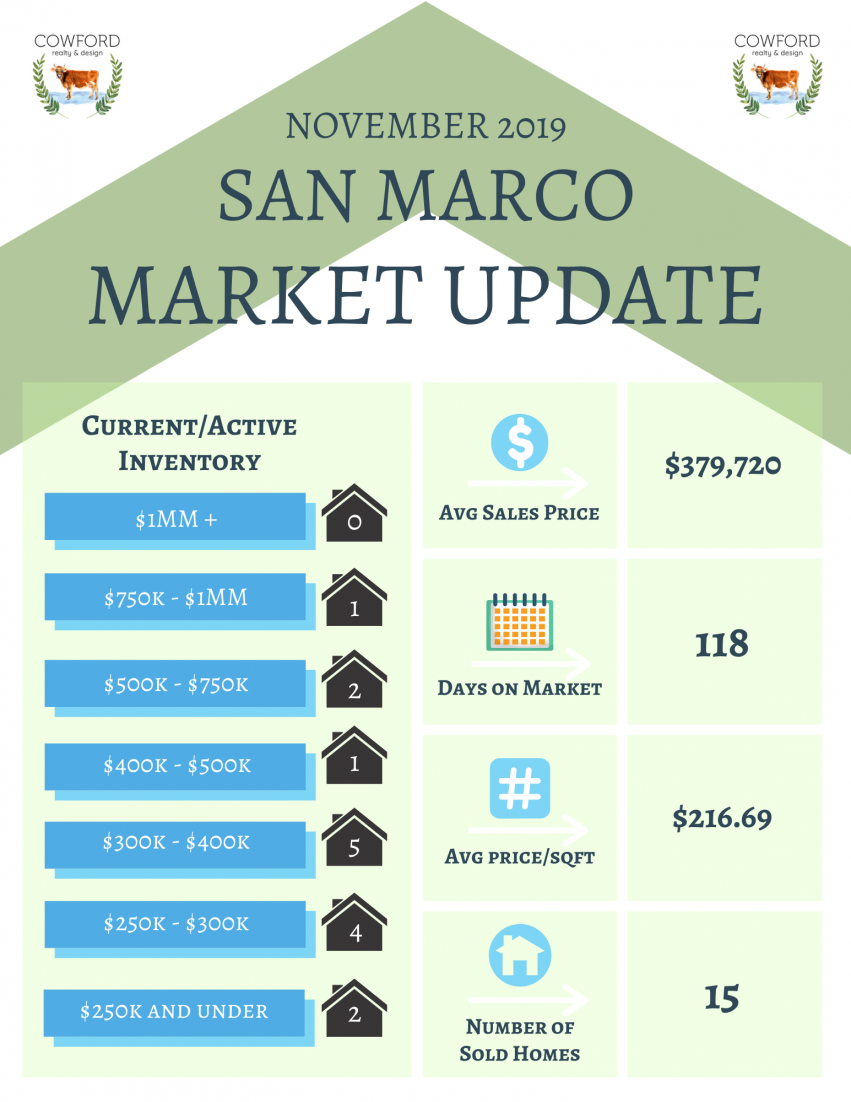
November 2019
October 2019

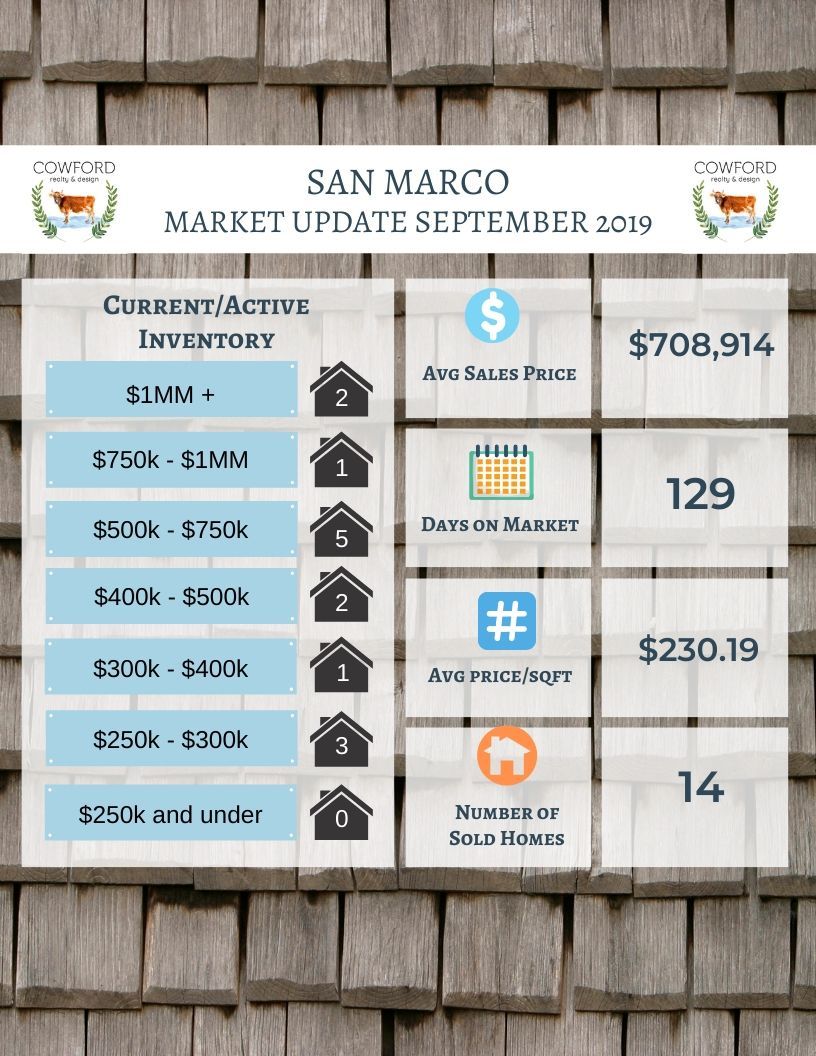
September 2019
San Marco had a great month, with 14 homes sold, compared to 5 homes last month. The average sales price this month was a little over $700k. Average days on market is staying stable at about 4 months. Take into consideration, though, that that includes homes at all price points. Higher priced homes have a smaller pool of buyers and typically take longer to sell.
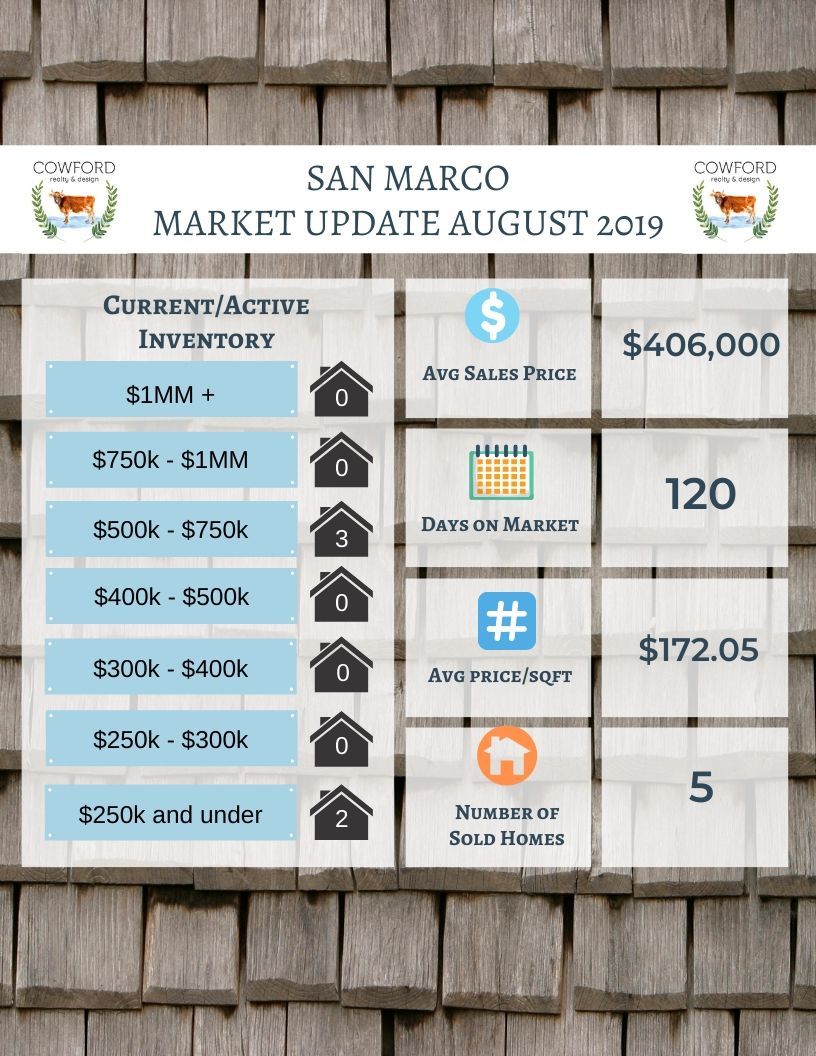
August 2019
The summer cool down was in full force this month, with 5 homes sold in San Marco. Days on market was up to 120 days.
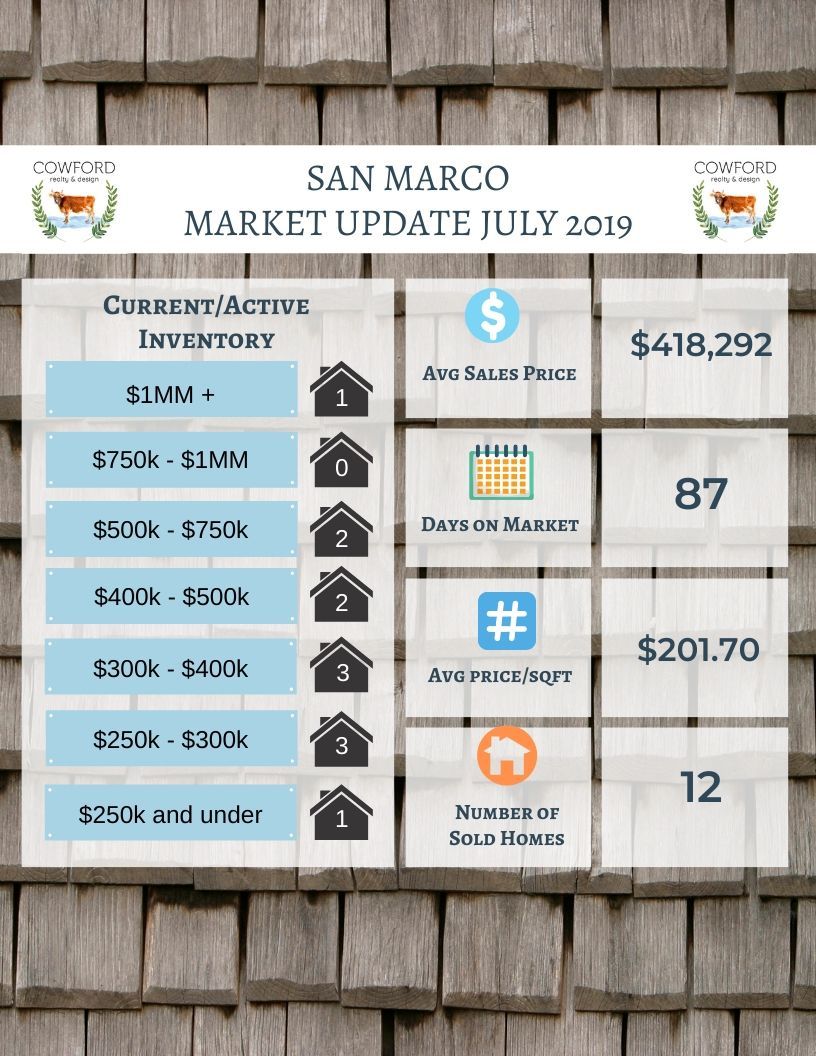
July 2019
Average sales price was up a bit to $419k, with 12 homes sold in July. Days on market is trending up, with 87 as the average.
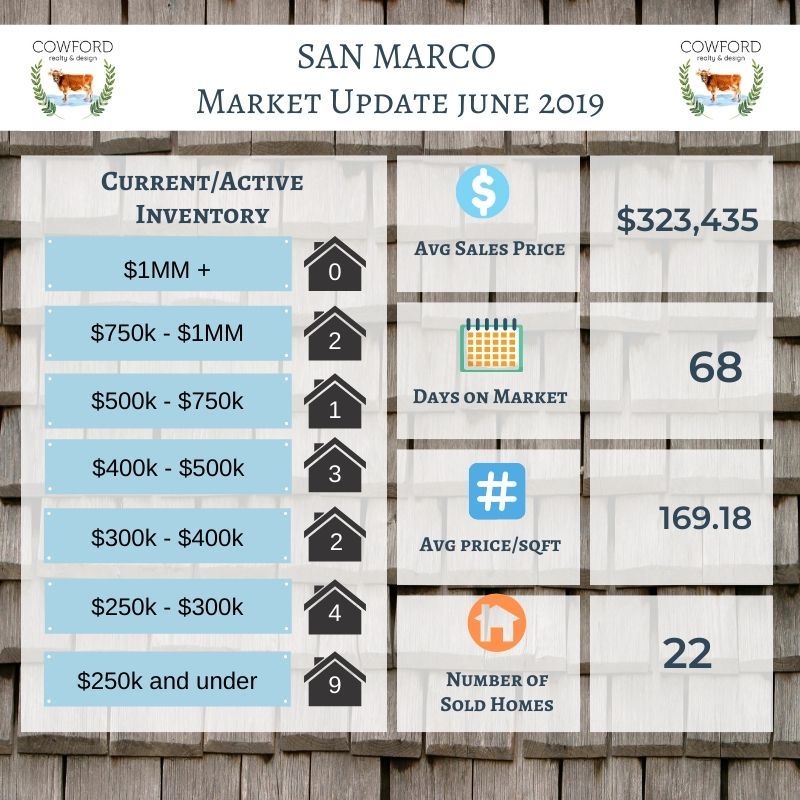
June 2019
June was a gangbuster month for San Marco, with 22 homes sold. Over a third of those were under the $250k mark, which is lower than the average sales price. Perhaps we will see these in the future as flips.